How to Calculate Income by Zip Code From US Census Data
In this post I’ll explain how I tabulated mean income by household from the 2010 American Community Survey by zip code.
The US Census provides lots of data at various geographical scales, but you often have to dig through its web site and combine tables together to get what you want. Unfortunately income by zip code is one of these data sets.
The good news is you can get a proxy for household income, household median income, and per capita income by zip code . The bad news is that unless you want to pay for a data source from ESRI or some other vendor, you’ll have to do some legwork to get this data.
Why doesn’t the Census provide income by zip code data tables?
Zip codes are created by the US Postal Service to help mail delivery. This is the main reason why the Census doesn’t use zip codes. (see this link to learn more). In contrast, the census views the country according to its own geographies—census tracts, census blocks, etc:
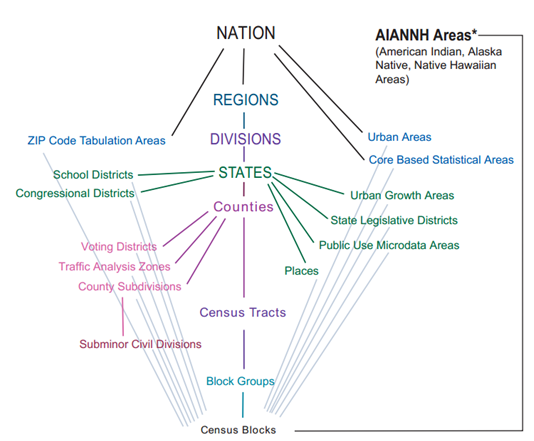
The census uses these geographies because it says census geographies are relatively stable over time while zip codes can cross state, place, county, and census geography boundaries as well as change over time. The census web site says that “Because of the ill-defined nature of ZIP Code boundaries, the Census Bureau does not have a file (crosswalk) showing the relationship between U.S. Census Bureau geography and U.S. Postal Service ZIP Codes.”
But since so many people want to view census data by zip code the census created a new statistical area called the ZIP Code Tabulation Area (ZCTA), which uses census blocks as the basis for Zip Code Tabulation Areas. It is this data source that we can use to link zip codes to income data.
Software and data sources used
Software
Ideally you’ll want to use a spatial analysis software like ArcGIS to spatially join census tracts to zip code tabulation areas. ArcGIS is a very expensive piece of software but it’s typically available free to students through their universities and they also have a home use version for $100! You can probably also use a scientific software package like NumPy to do this spatial join as well but this is probably a painful task so I wouldn’t recommend it.
In any case I’ll provide this join to you so you can just download my file at the end of this post.
You’ll also want a database on hand to easily join different tables together. I like MySQL or PostgreSQL, but Microsoft Access or Open Office Database work as well. And of course Excel works but you might have to manually perform the joins unless you’re an Excel ninja.
Data Sources
Income Data
The most granular level that the census provides income data at is the census tract level. The census’s data site contains a variety of tables you can download at different geographical levels.
Search for a data file. In my case I used S1902: Mean Income in the past 12 months (in 2010 inflation-adjusted dollars). Once you select the dataset you’ll be presented with a table. It’s easier to deal with the table with the rows and columns transposed, so click the customize table button and choose “Transpose Table.” Then download the data in csv format.
Census tract and zip code shapefiles
To download shapefiles for 2010 census tracts and zip code tabulation areas I went to the Census Tiger/Line Shapefiles site.
Linking census tracts to zip codes
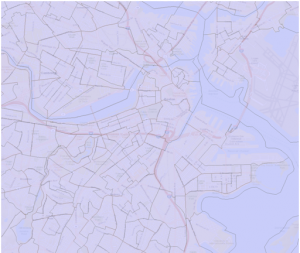
How do census tracts compare in area to zip code areas? I’ve found that in dense urban areas census tracts tend to be the same size or smaller than zip code tabulation areas, while in less populated areas census tracts can be larger than zip code areas.
For example, census tracts in Boston look like this:
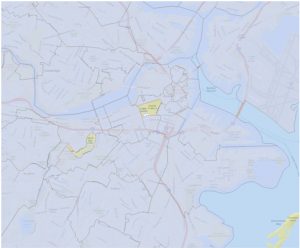
whereas zip code areas in Boston look like this:
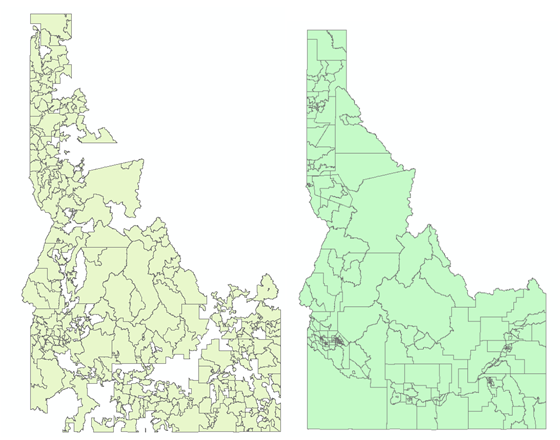
Also, not all zip codes are included in the census’s zip code tabulated areas data set, as this image of the census tract and zip code shapefiles for Idaho shows:
To link tracts to zip codes I used the spatial join tool in ArcGIS 10.1. How to do spatial joins is a complex topic and one I could spend a post (or two or three) talking about, but for the purposes of this post I’ll just tell you that I did a one-to-one join using the zip code layer as the target feature and the census tract as the join feature. For each zip code, I associated it with one census tract—the one that contained its centroid (center of area).
An alternate way is to do a one-to-many join so that any census tracts that intersect with that zip code are joined to it. You can then take an average income of all the census tract to estimate the income of that zip code, but then you’d also have to factor in what percentage of each census tract was in that zip code and figure out some weighting system to take this into account. I thought it was simpler to just join to one census tract because I assumed that adjacent census tracts probably don’t vary too greatly in income (probably valid for less dense areas but might not be the strongest assumption for dense urban cities where you might have a low income area right next to a higher income area).
Linking census tract data to zip codes
Each census tract income table will have a census tract ID associated with it. You can use this ID to join it to the appropriate zip code from the file I’ve provided. If you’re downloading your own data you should know that the ids in the factfinder seem to be integers, while the ids from the shapefiles are 11-character text data. This means you’ll need to convert the factfinder files to be 11 character text types padded by zeros on the left to be able to join the two data sets (converting to integers creates errors).
Other data processing you might want to do
Because cost of living varies by state, you might want to use a cost of living adjustment by state on the income data.