Linear Interpolation in MySQL
MySQL is often used to store time-series data. But it doesn’t offer a way to interpolate between time points which is useful in a lot of data analysis work.
(Interpolation is used to estimate values for periods between where you have actual measurements, and allows you to look at your data in a more continuous fashion representative of how things occur in the real world).
This can be a problem if you have granular time series data and want to analyze them at an aggregated level.
Example Problem: Interpolating Between Water Meter Readings
The easiest way to explain the problem and the hack I’ve used is to go through an example.
The Original Data Set
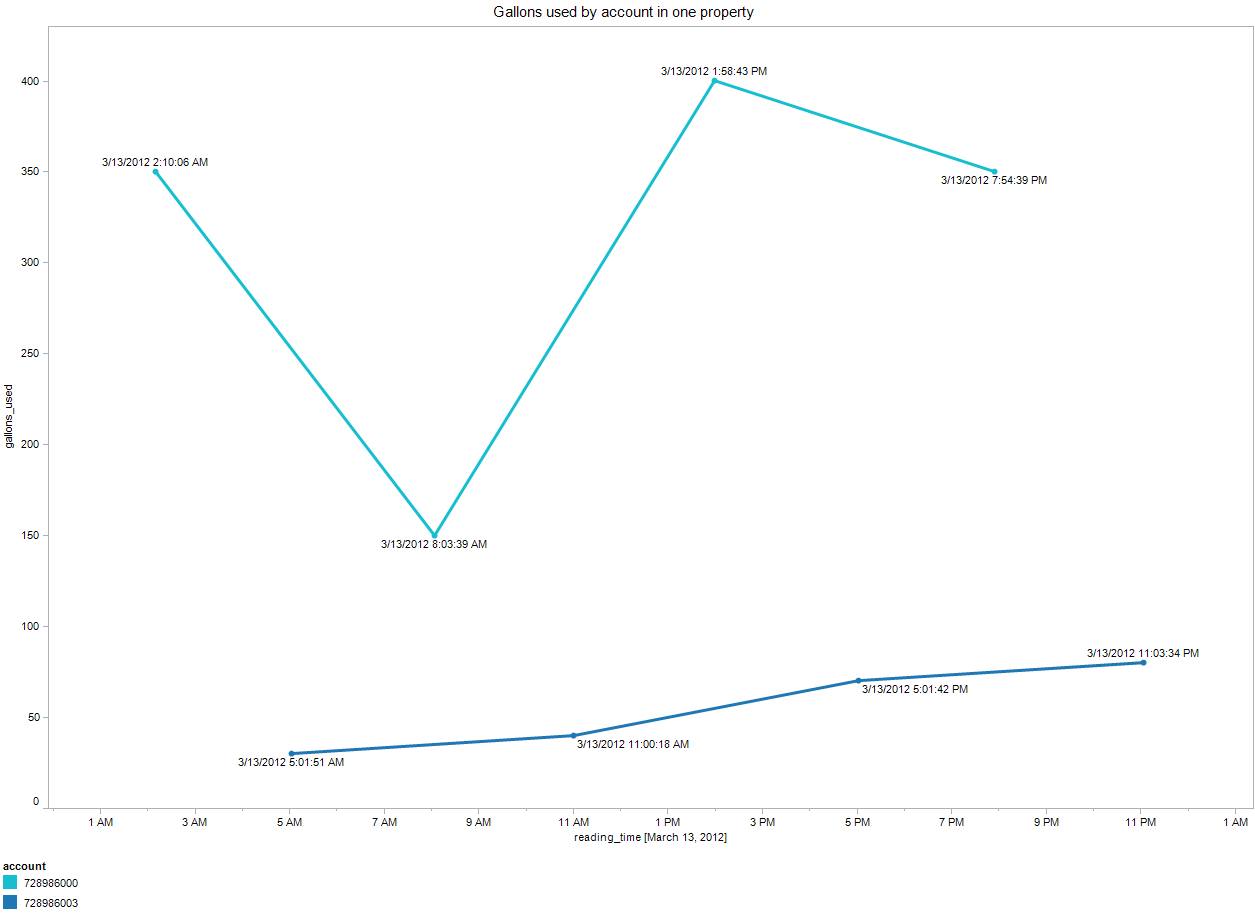
For my work I wanted to analyze how water use in a building changes over time and identify buildings that used more water than they should. The following plot shows a building with two water meters. Each water meter collects data at time increments spaced 6 hours apart, as shown below.
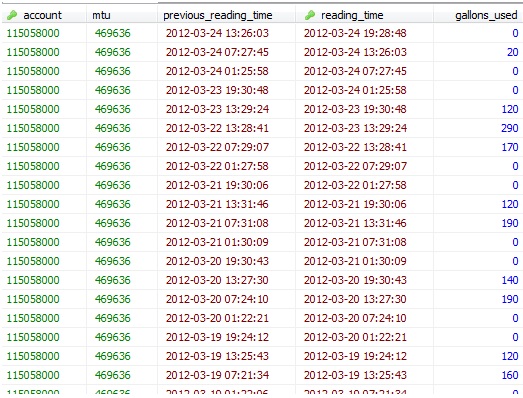
To give you a better sense of the data behind this plot, my original data table contains water accounts that are read at six hour intervals:
One way to get around this problem is to slice up the data into 6 hour periods or some other larger time block. But because the meters readings don’t occur every six hours we’re still likely to get periods where we only have reads of some meters.
Interpolation to the rescue
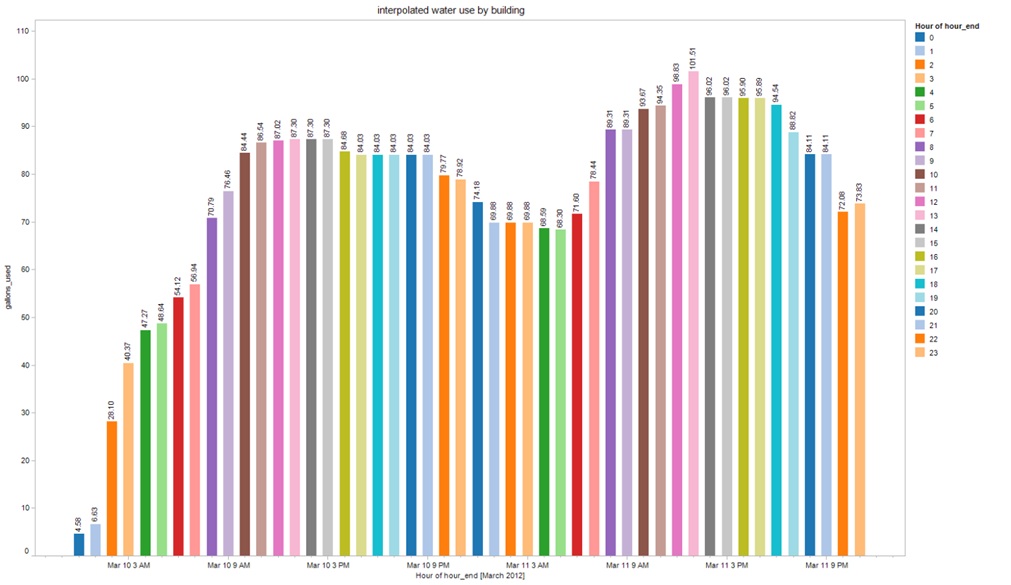
Using a simple linear interpolation between reads to estimate hour-by-hour use smooths the data and gives us water usage values that make much more sense.
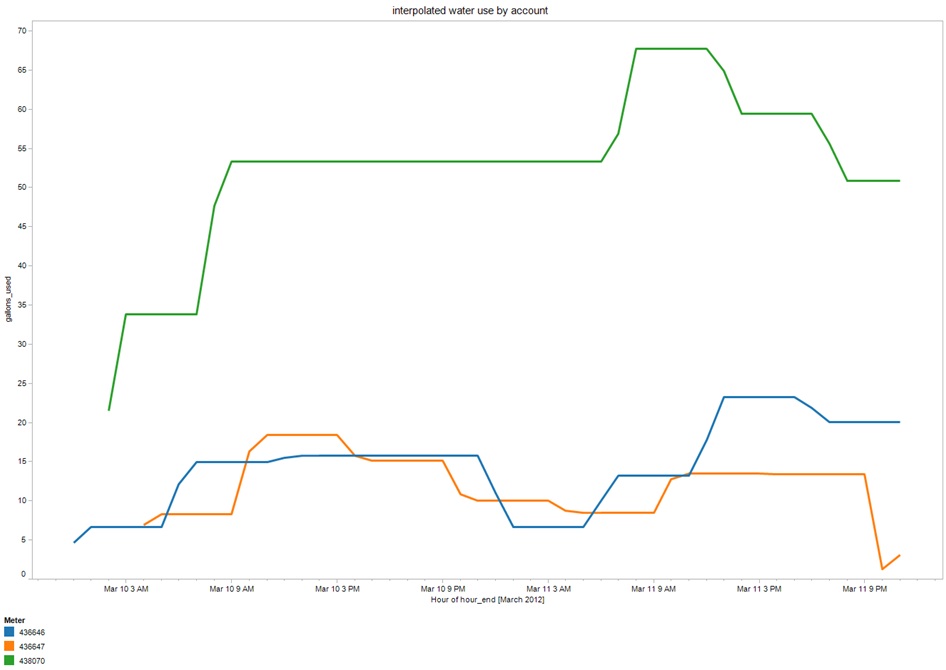
For a building with 3 water meters shown in the following plot, we can see that the use data is now smoothed out after we interpolated the use for each hour.
where the data in table form now looks like this:
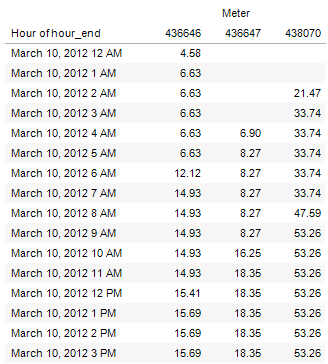
Most importantly, we can now analyze water use in the entire building and get the total use over all the meters hour by hour.
How to interpolate
The hack I use is fairly simple. It uses a separate table containing records that symbolize the time points you want to interpolate to, and does a join between this table and your original data table to get the interpolated data table. This process is described in more detail below:
Step 1: Your original data table should have start and end timestamps in each row. I inserted a picture of my original data table earlier in this post, but click here to see it again.
You will also need to calculate the value per smaller time period. For example in my case I calculate the average gallons used per hour or per minute. This value will then be scaled to calculate the use in each hour-by-hour interpolation.
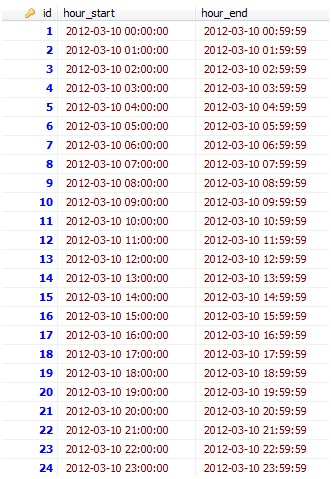
Step 2: To add in the interpolated points, I need to create another table and join it to my original data table.
This other table will contain rows that represent the smaller time granularity I want to interpolate to. Each row represents one unit of the small time granularity I want to examine. Because I want to analyze water use hour-by-hour, each row for me represents an hour of each day over the 2 week time span I have data. As with the original data table, each time period will be represented by start and end times as shown below.
I now join the two tables together with an inner join (not joining on any column) and a where clause:
CREATE TABLE `water_data_interpolated_hr_use` AS
SELECT
  building_name, account, meter, previous_reading_time,
  reading_time, avg_gallons_per_minute, hour_start,
  hour_end
FROM `bha_water_interval_data_avgminuse`
  JOIN `days_hours_for_interpolation`
WHERE
  `days_hours_for_interpolation`.hour_start >=
     DATE_SUB(`water _data`.previous_reading_time,INTERVAL 1 HOUR) AND
  `days_hours_for_interpolation`.hour_end  <=
      DATE_ADD(`water__data`.reading_time,INTERVAL 1 HOUR);
The Date_Sub and Date_add functions are needed to ensure that the join adds in the first and last hour periods. For example, if I was missing these functions and I had a reading from 8:45am to 9:45am, the first hour joined would be 9:00 to 9:59 instead of 8:00 to 8:59am.
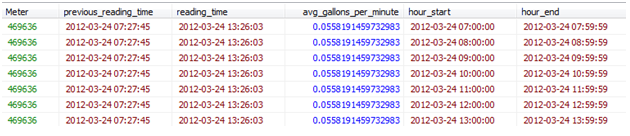
Now each record in the original data table has been split into multiple records, where each record represents an hour time period. In the following snapshot from my mysql table for one meter read, you can see it’s been split into 7 one-hour reads:
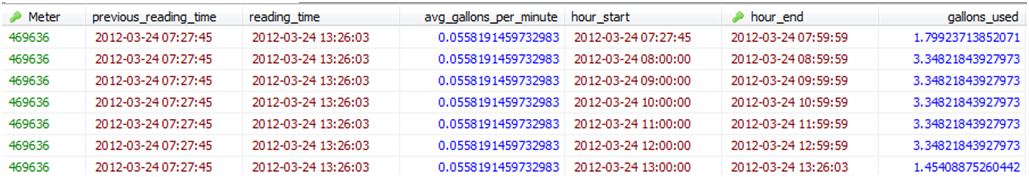
Step 3: Add in start and end dates to the first and final records in each interpolated read series
If you look at the last table you can see that the hour_start for the first hour isn’t actually the actual start for that read. The actual start time is the column called “previous_reading_time.” The same issue occurs for “hour_end” in the final hour.
Fixing this is pretty simple, just run a query to change the hourly start time to the first read time where the first read time is greater than the hour_start date, and similarly for the end record time:
UPDATE ` water_data_interpolated_hr_use `
SET hour_start = previous_reading_time
WHERE previous_reading_time > hour_start;

UPDATE ` water_data_interpolated_hr_use `
SET hour_end = reading_time
WHERE reading_time < hour_end;
We now have the proper start and end times and we can now calculate the water used in each time frame by scaling the average gallons used per minute field to the time span covered by each record.
Final thoughts
MySQL is great for querying and storing data but not so much for preprocessing data for analysis. You’re better off interpolating data in a package like MATLAB, R, or NumPy (see this MySQL forum post), but there may be some cases you don’t want to.
This hack I’ve used works but probably isn’t the most elegant. If anyone has suggestions about other techniques I’d love to hear them!